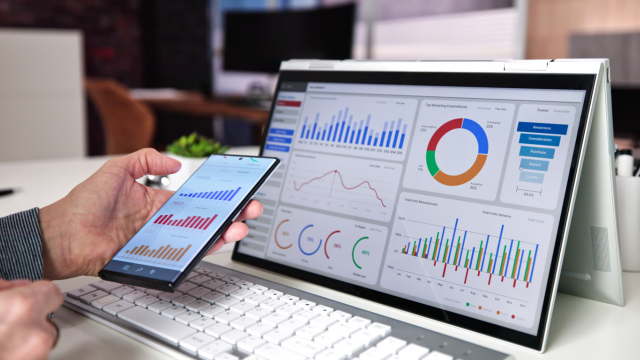

The best business dashboard software turns scattered company data into information people can understand and act on. Instead of checking separate spreadsheets, accounting systems, marketing platforms and CRM reports, a business can bring important measures into one place.
The challenge is deciding how sophisticated that place needs to be. A small agency may only want a few KPI dashboards showing sales, website traffic and cash performance. A larger organisation may need governed business intelligence, detailed financial reporting and hundreds of users with different access permissions.
The leading options therefore solve different problems. Power BI and Tableau provide substantial analytical depth. Looker Studio is useful for accessible web-based reporting. Databox and Geckoboard make operational metrics easier to communicate, while Zoho Analytics, Qlik and Klipfolio serve different levels of data integration and analysis.
This guide compares the strongest current options and explains how to choose reporting tools and analytics software that help people make decisions rather than simply creating more charts.
What Is Business Dashboard Software and Why Is It Important?
Business dashboard software gathers selected data and displays it through charts, tables, indicators and other visual elements.
A useful dashboard answers a defined business question.
A sales dashboard might show:
revenue;
pipeline value;
conversion rate;
average deal value;
sales against target.
A finance dashboard could show cash, revenue, gross margin, overdue receivables and expenditure against budget.
An operations dashboard might track orders, delays, capacity and quality issues.
Dashboards differ from ordinary reports because they are generally designed for repeated monitoring.
A report may explain what happened during the previous quarter. A dashboard can provide an updated view whenever the underlying information refreshes.
The most advanced platforms go further.
Modern business intelligence systems can combine information from databases, cloud applications and spreadsheets, apply common business definitions and let users explore why a metric changed.
The software is therefore only part of the solution.
A well-designed dashboard combines reliable data, meaningful metrics and clear presentation.
Why Business Dashboards Matter for Modern Businesses
Companies can have large amounts of data and still lack useful information.
The problem is often fragmentation.
Sales figures may live inside the CRM. Marketing performance sits in advertising platforms. Finance has accounting software, while operations uses separate systems and spreadsheets.
Managers then spend time assembling information before they can even begin discussing performance.
Dashboards can reduce this friction.
When the necessary data is connected properly, management can review important measures without repeatedly requesting manual reports.
This can also improve consistency.
If every department prepares its own version of “monthly revenue”, different calculations may produce different answers.
A governed dashboard allows organisations to establish agreed definitions.
Dashboards are particularly useful for trends.
A single monthly revenue figure tells management what happened during one period. A 12-month chart can show whether performance is improving, declining or simply fluctuating seasonally.
They can also reveal relationships.
For example, increasing sales combined with falling gross margin tells a different story from increasing sales alone.
The objective is not to put every available number on one screen.
It is to make important business intelligence changes easier to notice.
Essential Features to Look for in Business Dashboard Software
Different business intelligence need different capabilities, but several features deserve particular attention.
Data integration
The platform should connect to the systems containing the information the business intelligence actually uses.
That might include CRM, accounting, ecommerce, advertising, databases and spreadsheets.
A dashboard requiring employees to export and re-upload everything manually every day provides much less automation than one connected directly to source systems.
Appropriate refresh frequency
Not every dashboard needs real-time information.
Annual strategy measures may only need monthly updates.
A customer-support operations board might require changes every few minutes.
Faster refresh can cost more, so business intelligence should match refresh frequency to the decision being made.
Clear visualisation
Charts should help people understand information.
A dashboard with 30 gauges, seven colours and several animated widgets may look sophisticated while making comparison unnecessarily difficult.
Drill-down capability
Senior managers may want a summary first and additional detail when something changes.
Good tools can allow users to move from a KPI into the underlying regions, products or transactions.
Sharing and permissions
Consider who needs access and whether they should only view, explore or edit dashboards.
Permission controls become particularly important where financial, employee or commercially sensitive data is involved.
Mobile access
Executives and field teams may need dashboards away from a desktop.
AI assistance
Modern platforms increasingly provide automated summaries, natural-language questions and anomaly detection.
These features can be useful, but they should complement reliable underlying reporting rather than disguise weak data.
Best Business Dashboard Software
The strongest current platforms cover several different categories.
| Software | Particularly suitable for | Main strength |
| Microsoft Power BI | Organisations needing broad BI capability | Deep analysis and Microsoft integration |
| Looker Studio | Accessible web-based reporting | Flexible no-cost dashboards |
| Tableau | Advanced visual analysis | Powerful interactive visualisation |
| Databox | SMEs and marketing-led businesses | Fast KPI monitoring |
| Zoho Analytics | Small and growing businesses | Self-service reporting and analytics |
| Geckoboard | Operational teams | Simple live KPI visibility |
| Qlik Cloud Analytics | Larger analytical environments | Governed and AI-assisted analytics |
| Klipfolio | Custom multi-source dashboards | Flexible integrations and metric building |
Microsoft Power BI
Power BI remains one of the strongest all-purpose dashboard platforms.
It combines data preparation, modelling, interactive visualisation and business intelligence within the Microsoft ecosystem.
Power BI Desktop is available free and can connect to spreadsheets, databases and numerous other information sources.
Users can transform data through Power Query, define calculations and create interactive reports.
That makes the free desktop product surprisingly capable for an individual analyst or small business intelligence experimenting with BI.
The main distinction appears when reports need to be distributed.
Publishing and sharing across teams generally require Power BI Pro, Premium Per User or appropriate Microsoft Fabric capacity.
Power BI can be particularly attractive to business intelligence already using Excel, Azure, Microsoft 365 or Microsoft data services.
Its analytical depth can also become a disadvantage for very simple requirements.
A local shop wanting five headline metrics may find Power BI more complicated than a purpose-built KPI dashboard platform.
Looker Studio
Google Looker Studio is one of the strongest no-cost dashboard options.
It can build interactive reports using information from Google products, spreadsheets, databases and a large ecosystem of third-party connectors.
This makes it particularly useful for marketing reporting.
A business might combine Google Analytics, advertising information and spreadsheet data into one visual report.
Looker Studio can also be used for sales, financial or operational reporting where appropriate data connections exist.
The standard version is available at no cost.
Looker Studio Pro adds stronger organisational features including team workspaces, organisation-owned content, enhanced report scheduling, alerts and Gemini-assisted functionality.
The distinction matters for business intelligence.
A small team may be entirely comfortable with the free version.
A growing organisation may require better ownership and governance so critical reports do not effectively belong to one employee’s account.
Looker Studio is generally easier to adopt than a full enterprise BI platform, although extremely complex data modelling may be better handled elsewhere.
Tableau
Tableau remains one of the strongest tools for visual exploration.
Its major attraction is the ability to examine data interactively rather than limiting users to fixed management reports.
The introduction of Tableau Desktop Free Edition has also changed its accessibility.
Businesses can now use the free edition for local analysis with private business intelligence information rather than relying on Tableau Public, which is intended for public data and is not appropriate for confidential commercial dashboards.
Tableau Desktop Free Edition can connect to spreadsheets and live databases and provides substantial visual-analysis capability.
The limitation is collaboration.
Users who need to publish and share securely through Tableau Cloud or Server require paid capabilities.
Tableau’s paid ecosystem increasingly includes Tableau Pulse and Tableau Agent, bringing AI-assisted analysis into the platform.
Tableau is especially valuable when analysts need to explore relationships and create sophisticated interactive visualisations.
For a business requiring only a permanent television dashboard with eight metrics, it may be more software than necessary.
Databox
Databox is designed more directly around business KPI monitoring.
It can combine metrics from multiple applications into relatively straightforward dashboards without requiring the business intelligence to build a complete BI environment first.
This makes it attractive for small and medium-sized organisations.
Marketing agencies, sales teams andbusiness intelligence owners can connect familiar systems and bring high-level measures together.
Its current Free plan is also useful for experimentation.
It supports one user, three data sources and one dashboard, along with a limited number of custom metrics and monthly AI credits.
That is enough for a small business intelligence to determine whether the dashboard format is useful before paying for broader capability.
Databox has also moved further into AI-supported analysis, including its Genie AI analyst, performance summaries and anomaly detection.
Those capabilities are useful where managers want to investigate performance through conversational questions.
Its focus is narrower than a platform such as Power BI, but that can be an advantage for business intelligence that mainly want management visibility rather than complex analytical modelling.
Zoho Analytics
Zoho Analytics provides a useful middle ground between simple dashboard builders and enterprise BI platforms.
It supports visual reporting, dashboards, data integration and self-service analytics.
Its current Always Free plan is particularly notable for small reporting needs.
The free edition supports two users, five workspaces and up to 10,000 rows.
That limit is modest but can be enough for a small organisation learning how to structure its reporting.
Paid plans expand capacity and analytical capabilities.
Zoho’s Ask Zia functionality provides conversational analysis, while its wider AI features include automated insights and predictive capabilities depending on the plan.
Zoho Analytics becomes particularly attractive for companies already using other Zoho products because business intelligence information can remain within a more connected environment.
It can still work with external sources, so using the wider Zoho ecosystem is not compulsory.
Geckoboard
Geckoboard is designed around visibility.
It is particularly effective when a team needs a simple, continuously updating view of a small number of important measures.
The platform supports real-time or near-real-time dashboards using numerous business intelligence systems.
These can be displayed on televisions, shared through links or delivered as snapshots.
A customer-service team might show open support tickets, response times and satisfaction scores on a shared screen.
A sales team might display revenue, deals won and current target attainment.
The advantage is simplicity.
Geckoboard encourages teams to focus on metrics that employees genuinely need to see rather than constructing extremely complex analytical reports.
It is not currently a permanent free product. Its paid Essentials plan starts from $79 per month when billed annually, with higher tiers adding alerts, drill-down functions and additional dashboards.
That makes it better suited to organisations that value constant team visibility enough to justify a recurring subscription.
Best Free Business Dashboard Software

Several genuinely useful free options now exist.
Power BI Desktop
Power BI Desktop is one of the strongest free choices for individual report creation and analysis.
Users can build sophisticated reports locally without purchasing Power BI Pro.
The limitation arrives when secure organisational sharing becomes necessary.
Looker Studio
Looker Studio is particularly attractive where dashboards need to be shared online without a major software budget.
It can connect to a wide range of data sources and provides flexible interactive reports.
Some third-party connectors may still charge separately, so the dashboard software being free does not guarantee that the entire data pipeline is free.
Tableau Desktop Free Edition
Tableau Desktop Free Edition now offers substantial local analytical capability at no cost.
Unlike Tableau Public, it can be used privately with business intelligence information.
However, cloud publishing and team collaboration require paid products.
Zoho Analytics
Zoho’s Always Free plan can work for very small reporting environments.
Its current 10,000-row and two-user limits mean growing business intelligence may outgrow it relatively quickly.
Databox
Databox provides a limited free plan with one dashboard and three data sources.
This is especially useful for owners or analysts who want a simple executive KPI view rather than complex BI modelling.
The best free choice therefore depends on the requirement.
For advanced personal analysis, Power BI Desktop or Tableau Desktop Free Edition may be stronger.
For shareable web dashboards, Looker Studio is often more practical.
For a simple smallbusiness intelligenceKPI screen, Databox may require less setup.
Best Business Intelligence and Reporting Dashboards
Full business intelligence differs from simple KPI display because users generally need deeper exploration, modelling and governed data.
Power BI is one of the strongest options in this category.
It can bring data from many systems into analytical models and then create reports for different audiences.
Tableau is similarly powerful, especially for interactive visual exploration.
Qlik Cloud Analytics is another significant enterprise platform.
Its cloud environment combines Qlik’s established analytics technology with generative and predictive AI capabilities.
Qlik is especially relevant where business intelligence need broader enterprise governance and analytical scale rather than one simple dashboard.
Google Looker also deserves distinction from Looker Studio.
Looker is a broader enterprise BI platform with semantic modelling capabilities, while Looker Studio is primarily a reporting and visualisation product.
A business intelligence should therefore avoid treating every product containing “dashboard” as equivalent.
The more important questions are how data is modelled, how metrics are governed and what kinds of decisions users need to investigate.
Best Sales and Marketing Dashboard Software
Sales and marketing teams often need dashboards that integrate readily with cloud applications.
Databox is particularly useful here because its design centres heavily on connecting operational business intelligence metrics from popular systems.
A marketing team might track website traffic, leads, advertising performance and conversion measures in the same view.
Looker Studio is another strong option.
It is particularly convenient for businesses already working heavily with Google Analytics, Google advertising and spreadsheet data.
CRM-based sales dashboards can also work well in Power BI.
A business may combine pipeline information with finance data to show not only how much potential revenue sits in the pipeline but how sales convert into actual revenue and margin.
The important principle is to avoid vanity metrics.
A dashboard showing followers, impressions and website visits may look active without explaining whether marketing contributes to meaningful commercial outcomes.
Useful sales and marketing KPI dashboards should connect activity with outcomes such as qualified leads, conversion, acquisition cost, pipeline and revenue where those measures are appropriate.
Best Financial and Performance Dashboard Software
Financial dashboards need particularly reliable data because management may use them for cash, budgeting and investment decisions.
Power BI is well suited to financial reporting where organisations want to combine accounting, ERP or spreadsheet information.
Finance teams can create views covering revenue, expenditure, gross margin, cash and budget variance.
Zoho Analytics can also support financial and performance reporting and may be more accessible for smaller businesses.
Tableau is useful when finance teams want deeper visual investigation rather than simply presenting monthly numbers.
Businesses should take care with automated calculations.
If a dashboard shows “profit”, users need to know exactly how that figure has been defined.
The same applies to cash flow, recurring revenue, customer lifetime value and other measures.
A professional dashboard does not solve inconsistent accounting definitions.
Governance matters more than visual design.
Best Dashboard Software for Small Businesses
Small businesses should usually start with the simplest platform that answers important questions reliably.
Looker Studio is attractive where cost is the main consideration and the organisation wants shareable web reporting.
Databox can be easier where the goal is simply connecting several common business systems and watching headline KPIs.
Zoho Analytics provides a useful free starting point for slightly more structured analytical work.
Power BI Desktop becomes attractive where somebody in the business is comfortable building data models and expects reporting requirements to become more sophisticated.
A small company does not necessarily need enterprise analytics software.
Suppose a consultancy wants to track:
monthly revenue;
new enquiries;
proposal conversion;
overdue invoices;
customer retention.
If those five measures drive management discussions, building 15 dashboards containing 200 metrics would make reporting worse rather than better.
Start with the decisions management repeatedly needs to make.
Build dashboards around those decisions.
Expand only when additional information proves genuinely useful.
Best Real-Time Business Dashboard Tools
“Real-time” is often used loosely in software marketing.
Some platforms refresh every few seconds. Others update every few minutes, hourly or according to scheduled data imports.
Geckoboard is particularly focused on live operational visibility.
Its current Essentials plan says most metrics refresh instantly or within minutes depending on the source.
That makes it suitable for support, sales and operational teams where current activity matters.
Klipfolio also provides varying refresh speeds according to plan.
Its current Base tier refreshes every four hours, while higher tiers move through hourly and 15-minute refreshes to up-to-the-minute data in Team+.
Power BI can support near-real-time and streaming scenarios depending on architecture and licensing, while many ordinary datasets use scheduled refreshes instead.
Businesses should ask whether true real-time reporting creates a useful decision.
A director does not need the annual staff-training budget refreshed every 30 seconds.
A contact centre supervisor may genuinely need current queue information.
Faster data creates cost and technical complexity.
Use it where the speed changes what people can do.
How to Choose the Best Business Dashboard Software
Begin with the decision, not the software.
Ask what managers need to know frequently.
Then identify the source of that information.
If the answer already exists inside one application, its built-in dashboard may be enough.
A specialist dashboard becomes more valuable when information has to be combined across systems.
Next, decide how much analysis users require.
Do they simply need to see current KPIs?
Do they need to filter by department and product?
Will analysts need to build models and perform deeper investigation?
Then consider users.
One owner analysing data privately has very different licensing requirements from 200 employees accessing shared reports.
Review refresh requirements as well.
Daily may be enough.
Do not pay for live data because it sounds advanced.
Integration cost deserves attention too. A platform may advertise hundreds of data connections, but the connector your company actually needs might require a third-party subscription.
Finally, test data quality before investing heavily.
A beautifully designed dashboard built on inconsistent customer records will still produce unreliable conclusions.
How to Use Business Dashboards to Improve Decision Making
A dashboard becomes valuable when it leads to better questions.
Suppose revenue is 10% below target.
That information alone does not tell management what to do.
Drill further.
Has sales volume fallen?
Has average order value changed?
Is the decline concentrated in one product or region?
Did performance fall because several large contracts moved into the next month?
Good dashboards allow users to move from observation towards investigation.
Meetings should also use dashboards consistently.
Instead of every department preparing separate PowerPoint figures, teams can review an agreed source.
This reduces time spent debating whose numbers are correct.
The number of measures should remain controlled.
If everything becomes a KPI, nothing has priority.
Separate strategic measures from operational indicators.
Senior leadership may need only a small number of headline measures, while departmental dashboards contain additional detail.
Dashboards should also show context.
£500,000 of revenue means little without comparison.
Is it above budget?
Higher than last year?
Increasing or falling?
Data supports decisions when users can interpret it within a meaningful frame.
Benefits and Limitations of Business Dashboard Software

The biggest benefit is visibility.
Dashboards allow managers to see important information faster and more consistently.
Automation can also reduce reporting effort.
Instead of finance manually building the same spreadsheet pack each month, connected systems can refresh much of the data automatically.
Shared dashboards can improve alignment by giving different departments access to common definitions and results.
Interactive tools also support investigation.
Users can filter or drill into results rather than requesting another report whenever a new question appears.
There are limitations.
Dashboards can create false confidence.
A polished visual does not prove that the underlying data is accurate.
They can also encourage excessive focus on what is easily measured.
Some important issues—customer trust, management quality or strategic risk—cannot always be captured perfectly by one numerical KPI.
Too many dashboards create another problem.
Employees may receive multiple versions of the same metric and stop knowing which one is authoritative.
Data access must also be controlled appropriately.
A company-wide dashboard should not expose confidential financial, customer or employee information merely because sharing is technically easy.
The aim should be fewer, more trustworthy reporting views.
Future Trends in Business Dashboards and AI
Dashboards are gradually becoming more conversational.
Traditionally, analysts built the report and managers selected from the charts available.
AI increasingly allows users to ask questions directly.
A manager may be able to type:
“Why did gross margin decline this quarter?”
and receive a summary pointing towards relevant products or cost movements.
Microsoft, Google, Tableau, Zoho and other major analytics providers are all moving in this direction.
Another trend is proactive analysis.
Instead of waiting for a person to notice something on a dashboard, AI can detect unusual movements and alert users.
Databox already provides anomaly detection in its current product, while enterprise platforms increasingly incorporate similar analytical assistance.
The growth of UK business AI makes this development significant. Around 35% of businesses with 10 or more employees reported using at least one AI technology by June 2026.
However, AI dashboards create new risks.
An automatically generated explanation may sound confident while misunderstanding the underlying business context.
Metric governance therefore becomes even more important.
AI needs to know what “revenue”, “customer” and “conversion” mean inside the particular organisation.
The long-term direction may involve fewer static dashboards.
Users could receive personalised metrics, automated alerts and conversational answers based on one governed data environment.
The dashboard will become less of a destination and more of a continuously available interface to company information.
Key Takeaways
The best business dashboard software depends on how much analytical depth the organisation requires.
Power BI is a strong choice for comprehensive business intelligence, particularly within Microsoft-oriented organisations.
Looker Studio offers one of the best no-cost routes to interactive, shareable dashboards.
Tableau provides powerful visual analysis and now offers a free Desktop edition for local business use.
Databox is particularly accessible for SMEs wanting straightforward KPI dashboards, while Zoho Analytics provides a useful bridge between simple reporting and deeper self-service analytics.
Geckoboard works particularly well for teams that need constantly visible operational metrics.
Qlik serves more advanced enterprise analytics environments, while Klipfolio provides flexible multi-source dashboards with refresh speeds that vary by subscription.
Free options can be surprisingly capable, but collaboration, governance, AI and rapid refresh often move into paid tiers.
Most importantly, choose reporting tools according to the questions people need to answer rather than the number of charts the software can create.
Frequently Asked Questions
What is the best business dashboard software?
There is no single best platform for every business.
Power BI is strong for broad BI and Microsoft integration, Tableau for visual analysis, Looker Studio for accessible online dashboards and Databox for straightforward KPI monitoring.
Zoho Analytics, Qlik, Geckoboard and Klipfolio are also strong options for particular requirements.
What is the best free business dashboard software?
Looker Studio is one of the strongest free web-based dashboard platforms.
Power BI Desktop and Tableau Desktop Free Edition provide powerful free local analysis, while Zoho Analytics and Databox have limited free plans suitable for smaller reporting needs.
The right option depends partly on whether dashboards must be shared with other users.
Which dashboard software is best for small businesses?
Looker Studio, Databox and Zoho Analytics are particularly accessible to small businesses.
Power BI can also provide excellent value where someone has the skills to configure it.
Small companies should generally prioritise simple integration, affordable scaling and useful metrics rather than enterprise functionality they may never use.
What are the best business intelligence dashboard tools?
Power BI, Tableau, Google Looker and Qlik are significant business intelligence platforms.
Zoho Analytics can also provide broader BI capability for smaller organisations.
The best choice depends on data complexity, existing technology, governance requirements and the number and technical ability of users.
What features should business dashboard software have?
Useful features include reliable data connections, clear visualisation, filtering, permissions, scheduled or automatic refresh, sharing and mobile access where required.
Larger organisations may also need semantic modelling, audit controls, advanced security, forecasting and AI-assisted analysis.
Choose capabilities that support real reporting requirements.
How can business dashboards improve decision making?
Dashboards can make important changes easier to identify and reduce the time needed to assemble information.
They can also help users compare performance against targets and investigate underlying causes.
Better decisions are not automatic, however. Managers still need accurate data, meaningful KPIs and appropriate business judgement.
Can business dashboards integrate data from multiple sources?
Yes.
Major dashboard platforms can connect to spreadsheets, databases, CRM systems, accounting applications, cloud services and many other sources.
Integration depth differs between products, and some third-party connectors have additional costs.
Businesses should confirm support for their specific systems before selecting a platform.
How do I choose the right business dashboard software?
Start by defining which decisions and KPIs the dashboard must support.
Then identify data sources, users, refresh frequency, sharing requirements and security needs.
Compare products using a real reporting use case rather than demonstration dashboards.
The strongest option is usually the simplest system that can provide trustworthy information at the scale the business genuinely requires.

Conclusion
Choosing the best business dashboard software is ultimately about deciding how much information a business needs, how often it needs it and what people should be able to do with it.
Power BI offers extensive modelling, reporting and business intelligence capability, especially for organisations already working with Microsoft technology. Tableau provides sophisticated visual exploration, while its new Desktop Free Edition makes private local analysis more accessible.
Looker Studio remains an excellent option for organisations needing flexible shareable dashboards without an immediate software subscription. Databox and Zoho Analytics can make KPI reporting approachable for smaller organisations, while Geckoboard specialises in highly visible operational dashboards. Qlik and Klipfolio provide additional depth for more demanding integration and analytics requirements.
The software itself should not become the objective. Good KPI dashboards contain a limited number of measures that help people understand performance and make decisions. Filling a screen with every available number normally creates noise rather than insight.
AI will increasingly change the way dashboards are used. Managers will be able to ask questions, receive automated explanations and be alerted when unusual changes appear. Those features can make analytics software more accessible, but they also increase the importance of accurate data and agreed metric definitions.
Professionals wanting to strengthen their understanding of data and reporting can combine practical dashboard work with structured learning. Training Arena currently publishes learning material around data science, SQL and reporting concepts, including discussion of Tableau and Power BI. Such learning can introduce useful ideas, but competence develops through working with real datasets, checking calculations and learning how business measures should be interpreted.
The most useful reporting tools are therefore not necessarily those with the most impressive screens. They are the ones that put reliable information in front of the right people early enough for them to do something about it.